AIoT smart baby camera

@ Compal Electronics, 2023

AIoT smart baby camera

@ Compal Electronics, 2023

AIoT smart baby camera

@ Compal Electronics, 2023

User Behavior Analytics

User Behavior Analytics

User Behavior Analytics

Background

Background

Customer data in the App backend is scattered and comes from various sources. Additionally, no team within the organization has utilized a database to analyze user data from a data-driven perspective.

Goal

Goal

Monitioring customer data

Monitioring customer data

Quantitatively describe past user profiles

Validating product strategy

Validating product strategy

Validate whether each function meets the expected business and UX strategy goals through data
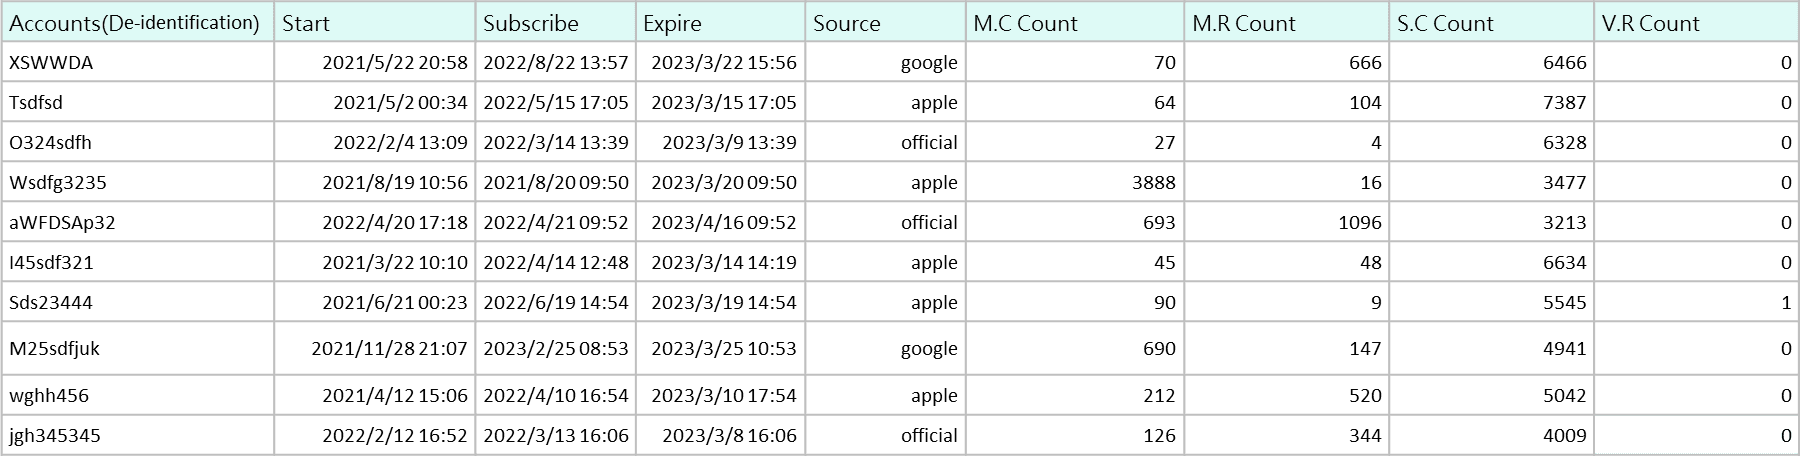
Approach and Tools

Approach and Tools

Data query

Descriptive Statistics and Graphical display

Analytics process

Analytics process

Aligned with the current marketing and UX strategy goals of the team:

Review the effectiveness of paid subscription strategies

Review the effectiveness of paid subscription strategies

Based on this, the required data fields are expanded, such as:


Overview of non-test accounts

Overview of non-test/newly created accounts

Overview of accounts with devices

Subscription status of non-test/accounts with devices

Subscription status of non-test/subscribed/device-less users

Renewal rate of non-test/subscribed/device users

Distribution of country/subscription source for non-test/device/subscribed accounts

Overview of total cloud usage data

Based on this, the required data fields are expanded, such as:

  • Overview of non-test accounts

  • Overview of non-test/newly created accounts

  • Overview of accounts with devices

  • Subscription status of non-test/accounts with devices

  • Subscription status of non-test/subscribed/device-less users

  • Renewal rate of non-test/subscribed/device users

  • Distribution of country/subscription source for non-test/device/subscribed accounts

  • Overview of total cloud usage data

(Due to commercial confidentiality restrictions, data content is modified and blurred, and the presentation process is the main one)

(Due to commercial confidentiality restrictions, data content is modified and blurred, and the presentation process is the main one)

(Due to commercial confidentiality restrictions, data content is modified and blurred, and the presentation process is the main one)

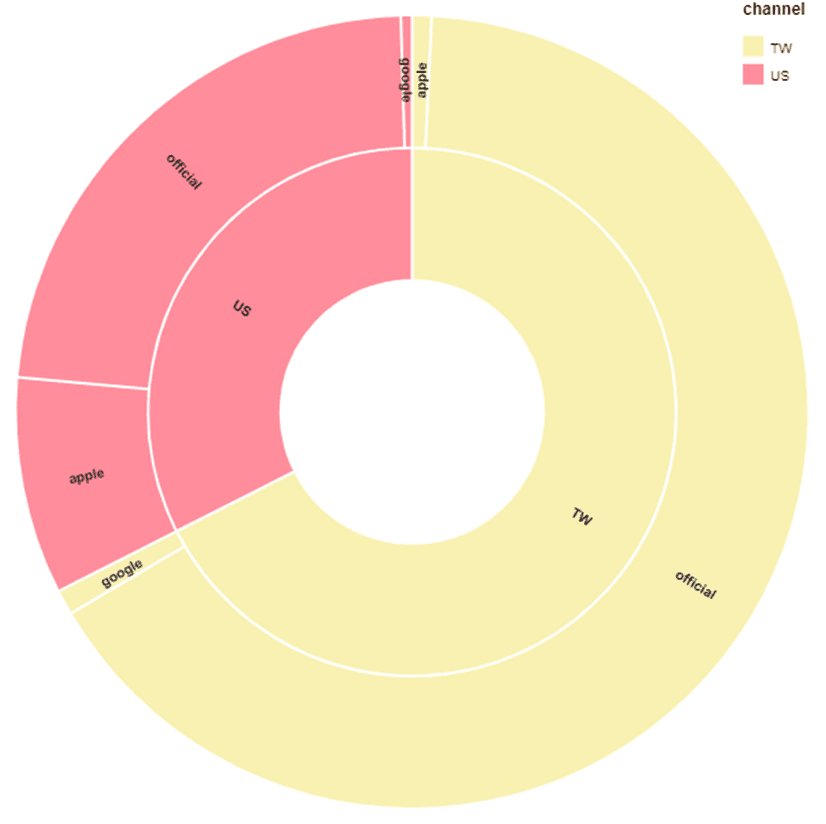
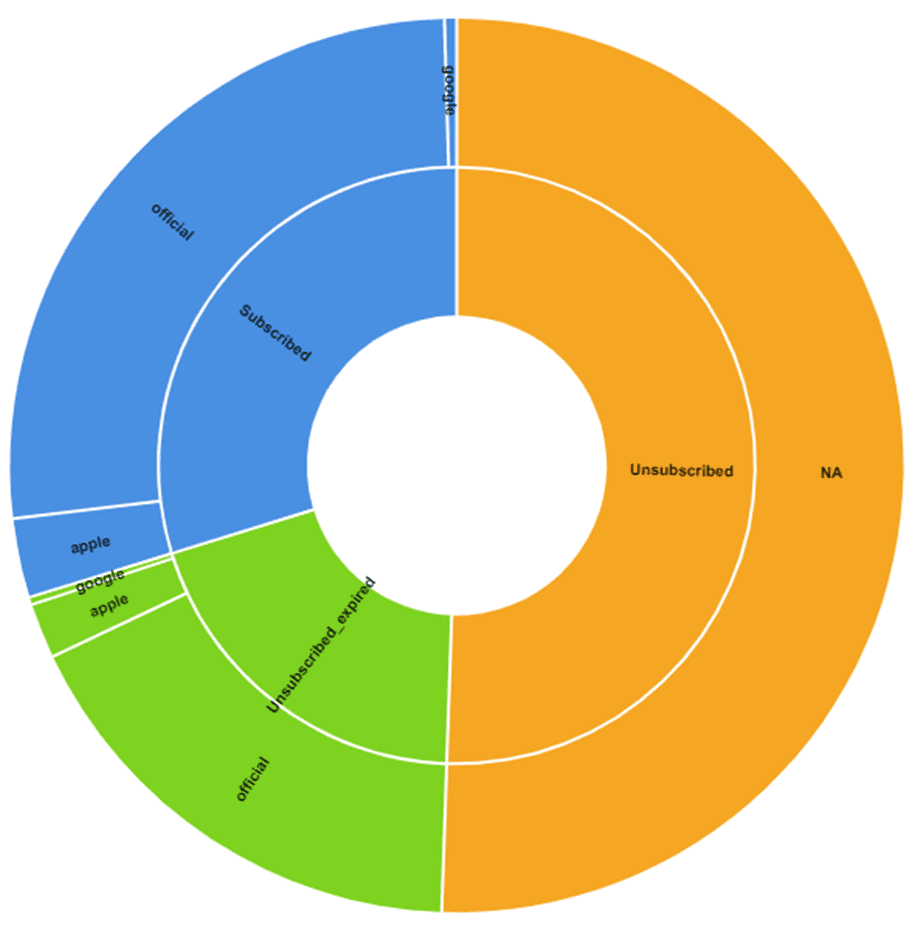
Proportion of people by region, source, and whether or not the subscription has expired

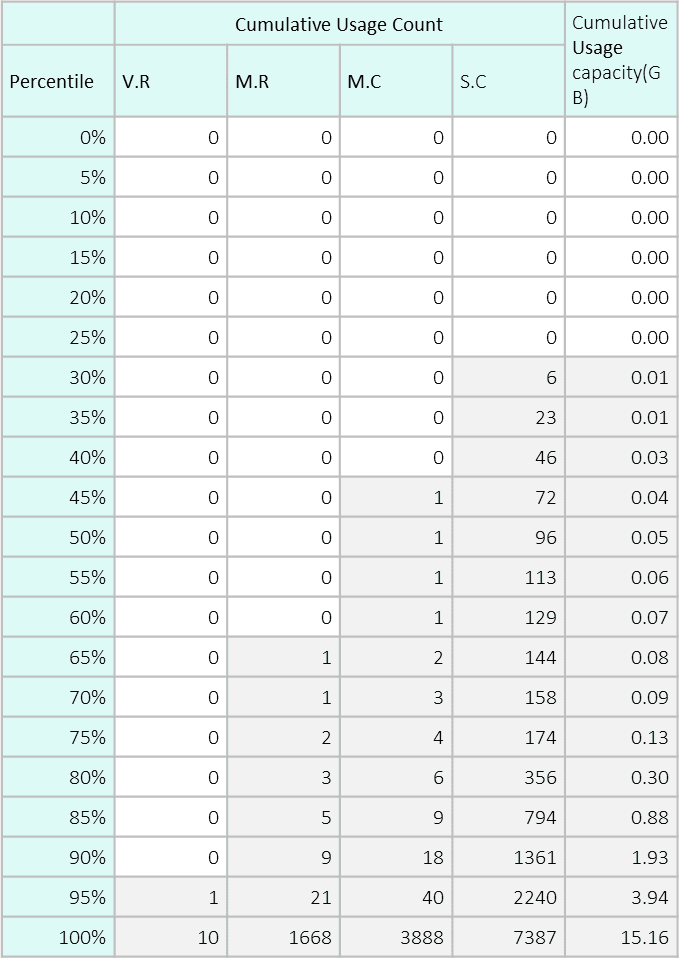
Percentiles of usage frequency for each function

Understand the general characteristics of the top 10 users in total usage

Understand the general characteristics of the top 10 users in total usage

Result

Result

(1) Identify the actual number of users and internal development test accounts, and identify test accounts that are not properly managed by the development team and standardize them

(2) Number of new users after each period, activity

(3) Number of new App users

(4) Number of users who have stopped using the product hardware

(5) Renewal rate and distribution of subscription users

(6) User's cloud storage capacity, corresponding to the number of photos and videos taken and recorded by the user using the monitor

  • Identify the actual number of users and internal development test accounts, and identify test accounts that are not properly managed by the development team and standardize them

  • Number of new users after each period, activity

  • Number of new App users

  • Number of users who have stopped using the product hardware

  • Renewal rate and distribution of subscription users

  • User's cloud storage capacity, corresponding to the number of photos and videos taken and recorded by the user using the monitor

Impact

Impact

(1) Compare the changes in the number of users in each user segment between time periods to identify the differences before and after events (Like: promotional activities, function updates), and verify that the effect of the subscription strategy is not as expected


(2) Understand the distribution of user groups and the frequency of use of each product function, and develop corresponding marketing plans for each group.


(3) In the process of data analysis, discover the reasons for the illogicality of the data, and feed back to the QA and software development teams for correction.

Create a free website with Framer, the website builder loved by startups, designers and agencies.